Drop a ball on to the top of a “peg maze” and the ball randomly bounces left or right off the pegs in route to the boom, its path impossible to predict. Many rivers have a peg maze of sorts: a boulder-strewn field blocking your raft’s path down the river.
“Reading and running” a river’s rock garden is very similar to investing. Your goal is to safely navigate the uncertainties and volatility of the financial markets. Your investment strategy is the entrance to your “financial rock garden”.
As the financial markets undergo their normal cycles of ups and downs, and as your personal circumstances change, you adjust your finances and investments. When you exit a financial rock garden, you have navigated a course that you could not have foreseen when you started.
Nicknamed a “rock garden”, this maze of rocks is too long and has too many rocks to effectively scout from shore. Rafters attack the maze with a resolve to “read and run”: stand in your moving raft when 30 or more yards upstream of the rapid, and within a few seconds, choose where to enter the rapid and the path through the first few rocks. You sit back down and row the course you envision, hoping you “read the water” correctly!
As you negotiate the each boulder in the maze, you are also looking ahead at obstacles seconds in front of you. You only have me to quickly react to the immediate risk of a rock a few feet from your raft’s bow.
Left? Right? Straight? These quick adjustments have you moving through the maze of rocks on a path much like the ball dropping through a peg maze. You could not have planned that route when you first entered the rock garden.
A Guide to Navigating Retirement, Topic #14: Just as there is no activity that can have a greater impact on your health than exercise, no activity can have a greater impact on your financial health than a Cash Flow Study.
A Cash Flow Study helps you to assess the financial obstacles you are likely to encounter in retirement—similar to rafters beaching their boat to scout a rapid and determine the best way through it. However, the metaphor fails because you can observe river rapids in real me. The financial rapids you will encounter in retirement remain merely academic discussions until the me you actually experience them.
Will it be possible then to scout a financial rapid? Will a rapid be a rock garden that you will need to “read and run”?
Last month’s newsletter comments that the flaw in a Cash Flow Study is its assumption that annual returns in your portfolio are the same every year. In practice, the annual returns will likely be higher or lower than the assumed return. Just as the path of a ball through a peg maze cannot be predicted yet it reaches the boom every me,
why is it problematic that your portfolio’s annual returns vary year-by-year if after a longer period of me, its compounded rate of return is equal to the Study’s assumption?
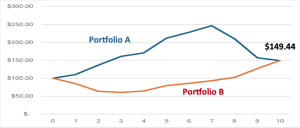
Chart 1: No Distributions
Click to view
Chart 1 illustrates the 10-year performance of two hypothetical portfolios, A and B,
whose annual returns are the same except for the order in which they experience those returns: Portfolio A enjoys a bull market in the first 3 years, and suffers a bear market in years 8-10. The timing of the occurrence of the bull and bear market in Portfolio B is the opposite. (Returns in years 4-7 are the same for both A and B.) Like a peg maze, both portfolios end at the same spot. After ten years, each has grown to the same dollar amount (both having earned a 4.1% annually compounded rate of return). If a Cash Flow Study assumed a 4.1% return even though the annual returns varied, where’s the flaw? Isn’t the long-term growth in both portfolios the same?
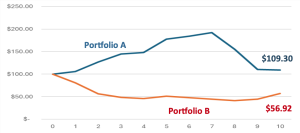
Chart 2: Annual Distributions
Click to view
Chart 2 illustrates the performance of the two portfolios when the same amount of money is distributed each year from both portfolios. Portfolio B is almost half the value of Portfolio A!
Distributions in a declining financial market can have severe consequences to an income portfolio’s future growth.
Cash Flow Studies can illustrate a “Monte Carlo” calculation in which upwards of 1,000 different “sequence of investment returns” occur. Many scenarios will prove quite fortuitous to you: your portfolio accumulations will greatly exceed the conservative assumptions of the Study. Unfortunately, many scenarios could also prove devastating to your portfolio’s ability to generate the inflation-adjusted, after-tax income so necessary for your long-term financial security. The Monte Carlo simulation can illustrate the range of possible portfolio accumulation in a format similar to the charts above. The simulation will also assign a percentage (from 0% to 100%) which indicates the probability that you will enjoy the income the Cash Flow Study projects.
The Monte Carlo simulation is informative about the extent of the long-term investment risk within your investment plan. The study can help you make adjustments to your financial plan to increase the probability of its success.
While the Monte Carlo simulation is instructive, it does not tell you how to manage the investment risk in your portfolio. June’s newsletter will discuss
the “Bucket Strategy” as a way to confront the unavoidable sequence of returns risk in your portfolio while accessing your savings for income during periods of negative returns.